这是大型软件、算法开发中容易被忽视同时也并不简单的一环,如何分析一个程序.这涉及到分析内存、使用一系列现有工具并进行可能冗长的测试. 但不管怎样,这是走向成熟应用关键的一步,
如何进行性能分析
过早的性能分析是万恶之源
你可以先完成程序的基本功能再进行优化,分析的方式和工具很多.最基础的包括计时.1
2
3
4
5
6
7
8
9
10
11
12
13
14
15
16import time, random
n = random.randint(1, 10) * 100
# 获取当前时间
start = time.time()
# 执行一些操作
print("Sleeping for {} ms".format(n))
time.sleep(n/1000)
# 比较当前时间和起始时间
print(time.time() - start)
# Output
# Sleeping for 500 ms
# 0.5713930130004883
考虑到一个程序执行时间包含太多部分,比如如果你的电脑同时跑着太多程序并且内存不太够,造成的中断等也会影响时间.
对于工具来说,需要区分真实时间、用户时间和系统时间.通常来说,用户时间+系统时间代表了进程所消耗的实际 CPU .
- 真实时间 - 从程序开始到结束流失掉的真实时间,包括其他进程的执行时间以及阻塞消耗的时间(例如等待 I/O或网络);
- User - CPU 执行用户代码所花费的时间;
- Sys - CPU 执行系统内核代码所花费的时间
对于cpu,内存,事件分析以及可视化等,都有一系列工具处理,具体可看调试及性能分析 · the missing semester of your cs education (missing-semester-cn.github.io)
深度学习模型的性能分析
如何评估一个模型在实际部署或者推理时的效果,计算量和参数都是重要因素,一个限制GPU/CPU,一个限制内存.
此外对于图像或视频,fps也是重要因素,对于大模型而言就是输出token的速度,说白了就是输出时间,影响了实时性和用户使用体验,个人认为这个因素也跟计算量和参数相关.
那么如何计算模型计算量和参数量呢?
根据字面意思,参数量好理解,无非几种网络结构,每种网络结构都或多或少有参数,每个参数当作f32或者其他类型计算即可. 当然实际推理或者部署完全可以使用量化的方法得到整数,甚至是i8类型.这样就把参数量降低了,此外浮点数变成了整数,事实上计算也降低了复杂度,因为浮点数计算在CPU/GPU上往往更复杂.
这样一想,计算参数量就比较简单了1
2
3
4
5
6
7
8def calc_param(model):
"""
Calculate the number of parameters in the model.
:param model: model
:return: number of parameters
"""
param_num = sum(p.numel() for p in model.parameters() if p.requires_grad)
print(param_num*4/1024/1024, 'MB') # assume dtype float32
那如何计算计算量呢,由于浮点数和整数运算上在CPU计算的不同,我们只考虑更为复杂的浮点数计算,就有了FLOPs. FLOPS计算如下,卷积层和全连接计算不同
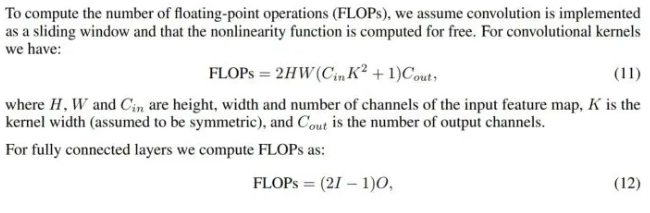
还有些地方使用的是MACs和MAdds,
MAC:Multiply Accumulate,乘加运算。乘积累加运算(英语:Multiply Accumulate, MAC)是在数字信号处理器或一些微处理器中的特殊运算。实现此运算操作的硬件电路单元,被称为“乘数累加器”。这种运算的操作,是将乘法的乘积结果和累加器的值相加,再存入累加器:
使用MAC可以将原本需要的两个指令操作减少到一个指令操作,从而提高运算效率。
MAdds 本质上与 MACs 相同,都是指一次乘法和一次加法的组合。术语 MAdds 更常见于一些文献中,尤其是早期的文献。实际上,在大多数情况下,MACs 和 MAdds 可以互换使用.
1个 MACs 包含一个乘法操作与一个加法操作,大约包含2个 FLOPs。因此,通常 MACs 与 FLOPs 存在一个2倍的关系。(但是很多时候又会把它们会混淆合在一起)
抽象地高度来说
- 计算量是指网络模型需要计算的运算次数,参数量是指网络模型自带的参数数量多少
- 计算量对应时间复杂度,参数量对应于空间复杂度
- 计算量决定了网络执行时间的长短,参数量决定了占用显存的量
5种方法获取Torch网络模型参数量计算量等信息_查看模型参数量-CSDN博客
fvcore
Meta的开源工具,包含pytorch layers,计算flop,计算参数,
FlopCountAnalysis1
2
3
4
5
6
7
8
9
10
11
12
13
14
15
16from fvcore.nn import FlopCountAnalysis
flops = FlopCountAnalysis(model, input)
flops.total()
flops.by_operator()
Counter({'conv': 194616, 'addmm': 80040})
flops.by_module()
Counter({'': 274656, 'conv1': 48600,
'conv2': 146016, 'fc1': 69120,
'fc2': 10080, 'fc3': 840})
flops.by_module_and_operator()
{'': Counter({'conv': 194616, 'addmm': 80040}),
'conv1': Counter({'conv': 48600}),
'conv2': Counter({'conv': 146016}),
'fc1': Counter({'addmm': 69120}),
'fc2': Counter({'addmm': 10080}),
'fc3': Counter({'addmm': 840})}
flop_count_table
Format the per-module parameters and flops of a model in a table1
print(flop_count_table(FlopCountAnalysis(model, inputs)))
可以单独看某个模块的参数量和计算量.
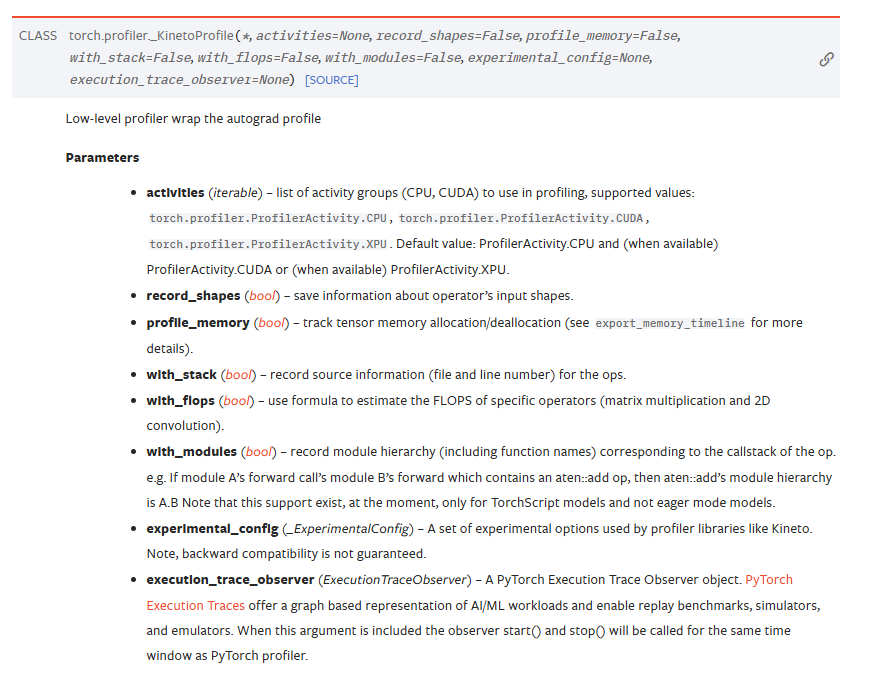
torch profiler
pytorch官方工具
PyTorch Profiler是一个允许在训练和推理期间收集性能指标的工具。Profiler的上下文管理器API可以用来更好地理解哪些模型操作符是最昂贵的,检查它们的输入形状和堆栈跟踪,研究设备内核活动并可视化执行跟踪
1 | with torch.no_grad(): |
上面计算了GPU和CPU的时间1
2
3
4
5
6
7
8
9with torch.profiler.profile(
activities=[
torch.profiler.ProfilerActivity.CPU,
torch.profiler.ProfilerActivity.CUDA,
]
) as p:
code_to_profile()
print(p.key_averages().table(
sort_by="self_cuda_time_total", row_limit=-1))
deepspeed
大模型训练的加速框架,微软开源的.一般的模型上面两个足以.这里不过多介绍.1
2
3
4
5
6
7
8
9
10
11
12
13
14
15
16
17
18
19
20
21
22
23
24
25
26
27
28
29
30
31
32from deepspeed.profiling.flops_profiler import FlopsProfiler
model = Model()
prof = FlopsProfiler(model)
profile_step = 5
print_profile= True
for step, batch in enumerate(data_loader):
# start profiling at training step "profile_step"
if step == profile_step:
prof.start_profile()
# forward() method
loss = model(batch)
# end profiling and print output
if step == profile_step: # if using multi nodes, check global_rank == 0 as well
prof.stop_profile()
flops = prof.get_total_flops()
macs = prof.get_total_macs()
params = prof.get_total_params()
if print_profile:
prof.print_model_profile(profile_step=profile_step)
prof.end_profile()
# runs backpropagation
loss.backward()
# weight update
optimizer.step()
除了上面几个之外,还有thop,stat以及ptflops等,其中一个问题时,很多库要求给出输出的tensor shape,但实际情况是输入的是一个list或者dict然后在模型中进行处理,为了避免模型改动,我推荐可以使用thop.
运行模型时间
前面讲到如果要测试程序时间,并没有想的那么简单.在pytorch中提供了torch.cuda.Event
HEAL/opencood/tools/profiler/params_calc.py at 4882bd02514725fa5e2e5717d410de739f33790e · yifanlu0227/HEAL (github.com)1
2
3
4
5
6
7
8
9
10
11
12
13
14
15
16
17
18
19
20
21
22
23
24
25
26
27
28
29
30
31
32def inference_throughput_cuda_event(model, data):
print("start inference throughput performance test")
run_num = 50
print('warm up ...\n')
with torch.no_grad(): # warm up
for i in range(run_num):
output = model(data)
print('warm up done.')
# synchronize 等待所有 GPU 任务处理完才返回 CPU 主线程
torch.cuda.synchronize()
# 设置用于测量时间的 cuda Event, 这是PyTorch 官方推荐的接口
starter, ender = torch.cuda.Event(enable_timing=True), torch.cuda.Event(enable_timing=True)
# 初始化一个时间容器
run_num = 200
timings = np.zeros((run_num,))
print('start testing ...\n')
with torch.no_grad():
for i in range(run_num):
starter.record()
output = model(data)
ender.record()
torch.cuda.synchronize() # 等待GPU任务完成
curr_time = starter.elapsed_time(ender) # 从 starter 到 ender 之间用时,单位为毫秒
timings[i] = curr_time / 1000
infer_thro = run_num / timings.sum()
print("inference throughput (cuda event): ", infer_thro)
return infer_thro
经过我自己测试,如果显存足够的情况下,很多时候直接使用time结果类似1
2
3
4
5start_time = time.time()
for i in range(run_num):
output = model(data)
end_time = time.time()
infer_thro = run_num / (end_time - start_time)
